Category Archive : Artificial Intelligence

Path with Blind Curve

Where Is the Training Path Leading?


4 October 2019

ATD recently shared a list of the Top 20 eLearning Statistics to Know for 2019. The figures show companies are investing in training and eLearning. Those companies who are cognizant of their investment receive the dividends with employee growth and retention. Thinking about this, how could training programs be improved? As training leaders, we understand that programs which stay the same or rely on the status quo – slowly atrophy. What is the answer?

Discovering the Answer

Unfortunately, there is not a map with a big, red X that will lead you to the answer. Every training program’s answer or solution(s) is specific to their organization. Because organizational culture and training lead to learner needs, the training managers must consider the questions before searching for answers. Looking at some possible training topics, here are a few potential ideas for questions.

Possible Areas to Question

  • Did the safety training impact the incidents?
  • Does more or type of sales training impact revenue?
  • Does communication or other soft skills training impact customer satisfaction?

Advanced AI Learner Analytics Tool (AAILAT)

Based on the question(s), our team will gather an organizations ‘structured’ and ‘unstructured’ data to search for commonalities and patterns. Our AAILAT will provide access, exploration, summary, analysis, and interaction capabilities. This leads to the discovery of missed conclusions and data points. 

Our team pairs the AAILAT with our Training Evaluation Benefits Report (TEBR) which provides a summary of the conclusions, data points, insights of learners needs and recommendations for future training goals or objectives. The TEBR will be provided monthly, quarterly, and annually to training managers.

Final Thoughts

The customized AAILAT will remain flexible and cost-effective for organizations. We offer two demo videos. The first is more descriptive (less than 3 minutes) of the AAILAT. The second provides only a high level overview taking less than a minute.

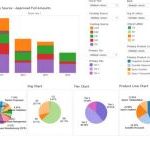
Analytics Results given in Bars & Pie Charts

AI for Learner Analytics

27 August 2019

Organizations reported spending a total of $87.6 billion on training costs in 2018. Each organization’s learning and development (L&D) team collects data about the training and learners from various sources. The data drives the justification for future training investment by providing organizational leadership the return on investment (ROI) insights and facts.

Facing the Data Challenge

Unfortunately, L&D directors cannot simply open a dashboard to retrieve any desired analytics on the learners and thereby the training. To have a complete learner analytics view, L&D directors must task their teams to gather “unstructured” data (ex: instructor-led, webinars, focus groups, etc.) and “structured” data (ex: LMS, mobile, etc.).

Requirements for “Unstructured” Data

L&D teams perform the daunting task of first gathering all the “unstructured” data in a single location before any analyzing can occur using designated programs. The “unstructured” data is gathered from instructor-led, webinars, or focus groups. These are usually verbal or hand-written responses which must be typed or transcribed into a spreadsheet before analysis can begin. Part of the analysis will be a search for common phrases in the responses. However, in a spreadsheet of 1000s of responses, this will be a time consuming process for the L&D team.

Requirements for “Structured” Data

Beyond the “unstructured” data, “structured” data is gathered from the LMS or mobile training platforms. These platforms usually provide “structured” data in a spreadsheet that includes details about assessments, completion rates, optional training material usage, etc. This format allows L&D teams to easily analyze the “structured” data for any issues or insights for future training sessions.

AI Learner Analytics Solution

However, L&D teams desiring to analyze “unstructured” data for the same result or to compare “unstructured” and “structured” data for commonalities will find difficulties due to incompatibility with the sources. This leads to missed conclusions, data points, and insights on learners and training.

Utilizing Text Analytics

Our team’s AI for text analytics functions in a way similar to our brains. The algorithms process whole paragraphs and lines of text to gain understanding and classify in themes. Our analyst will train a set of “agents” based on the desired insights from the L&D team. A single agent is responsible for one theme. The more open-ended responses processed the better at predicting outcomes, classifying, and identifying themes. After training, agents are “turned loose” on the entire set of open-ended responses, yielding a comprehensive scoring and ranking of the themes expressed by your learners. As the agents analyze more data, they will need to be adjusted based on the scoring results.

Customized AI Learner Analytics Solution

Our team’s personalized AI solution provides access, summarization, exploration, analysis and interaction capabilities to L&D teams. We collaborate with the organization’s L&D team to first design and develop a solution based on the needs and capabilities. We ask questions to determine what themes or insights are the targets for the textual data. This establishes what agents will be built for the text analytics. Other considerations include:

  • Single interface or dashboard ability to view data.
  • Interactive dashboards built to specific needs.
  • Data extracted and appended within designated entities and sentiments (dashboard areas).
  • Supplemented with an open intelligence for context.
  • Provide domain specific core concepts and themes using our AI technology.
  • Provide maintenance through cloud service or on premise service.

Conclusion

Data for L&D directors is available in “unstructured” and “structured” data formats. Unfortunately, it is time consuming for their teams to sufficiently collect and analyze. Our team assists in designing and developing an AI solution which will provide the learner analytics for your organization’s L&D team to not only justify the training but also improve overall training effectiveness through unidentified insights and data points. 

We customize each AI learner analytics solution to meet each L&D team’s needs while remaining flexible and cost effective to the organization. Our team also considers the AI solution as an application for any type of training analytics (i.e. predictive analytics – safety training, sales analytics, etc.). For additional information, contact us.

Analysis Notes

Data Analysis + Training Analysis = Complete ROI ‘Picture’

9 October 2018


Analysis Notes

With today’s data analysis tools, why would anyone need further training analysis to determine if the training was worthwhile? To answer this question, we need to consider two more questions: 

  1. What does data analysis provide?
  2. What does training analysis provide?

The answer to these questions will answer the first question of why training analysis is needed in conjunction with data analysis.

What Data Analysis Provides?

Feedback on Chalkboard

Data analysis offers good insights about your learners and their habits while performing the training. Depending on the data analysis tools you use, SCORM or xAPI, your data may be minimum or robust. 

For example, with SCORM data, you may track that your learners log into an LMS to take online training or to register for a virtual live training. The LMS tracks their completion or pass/fail of the test. If there are media, it will track the media was engaged. 

However, if xAPI data is used, you may track how often a user logs in to a course. The incorrect answer(s) chosen before the correct answer was chosen. If a media was selected, how long the media was played. For each page, you may know if it was reloaded, how long a learner stayed on the page, etc. These details are valuable for designing and updating the training.

What Training Analysis Provides?

While the data analysis is critical to the design and update of the training for the learner, it is not the only requirement for determining the overall worth of the training. An analysis must be done of the learner in their environment to determine if the training had a impact. 

Does the learner use the training? Has it become part of their repeated task performance? Also, how does leadership respond to the training? Do they encourage and reinforce the behaviors or are they ambivalent? 

These factors cannot be measured or collected by data analytics, but must be observed and shared in focus groups and surveys. In the best situation, an experienced instructional designer reviews the training goals, objectives, and any enterprise goals before performing an unscheduled to the learner observation. The data gathered during the observation can then be compared to the data analysis from the LMS for a full report.

Conclusion

Data analysis tools provide good insights for instructional designers. However, we should never forget about the personal attention required through observation, interviews, and surveys which provide the full analysis report. These together will help determine if the training program is an investment which should continue as is or needs restructuring.

Beyond these, our customized AI solution paired with analyst reviews provides a complete ROI view to clients. QAA’s clients are presents with training recommendations based on data insights found in the analysis supported by the customized AI solution.